Exposed Kubernetes dashboard
This finding informs you that your EKS Cluster dashboard was exposed to the internet by a Load Balancer service. An exposed dashboard makes the management interface of your cluster publicly accessible from the internet and allows bad actors to exploit any authentication and access control gaps that may be present.
To simulate this we will need install the Kubernetes dashboard component. We'll be using the version v2.7.0 of the dashboard, which is latest compatible with EKS Cluster v1.31 based on the release notes.
After that we can expose the dashboard to the Internet with Service type LoadBalancer, which will create a Network Load Balancer (NLB) in your AWS Account.
Run the following commands, to install the Kubernetes dashboard component. This will create a new Namespace called kubernetes-dashboard, and all the resources will be deployed there.
NAME READY STATUS RESTARTS AGE
dashboard-metrics-scraper-64bcc67c9c-tt9vl 1/1 Running 0 66s
kubernetes-dashboard-5c8bd6b59-945zj 1/1 Running 0 66s
Now, let us patch the newly created kubernetes-dashboard Service to be type LoadBalancer.
After a couple of minutes, the NLB will be created and show a publicly accessible address in the kubernetes-dashboard Service.
NAME TYPE CLUSTER-IP EXTERNAL-IP PORT(S) AGE
dashboard-metrics-scraper ClusterIP 172.20.8.169 <none> 8000/TCP 3m
kubernetes-dashboard LoadBalancer 172.20.218.132 ad0fbc5914a2c4d1baa8dcc32101196b-2094501166.us-west-2.elb.amazonaws.com 443:32762/TCP 3m1s
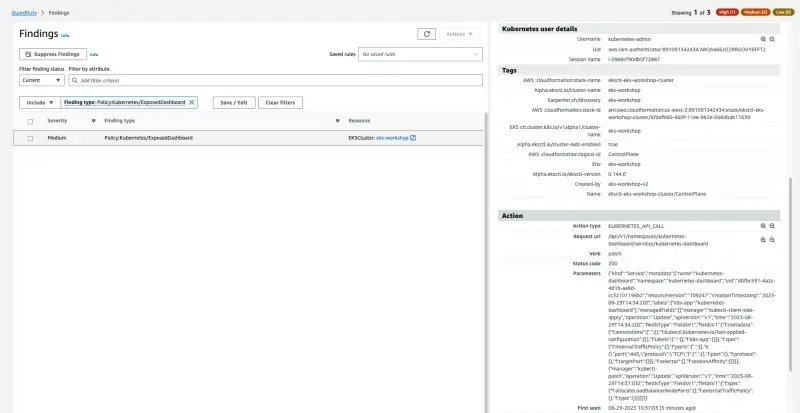
If you go back to the GuardDuty Findings console, you will see the finding Policy:Kubernetes/ExposedDashboard. Again use sometime to analyze the Finding details, Action, and Detective Investigation.
Uninstall the Kubernetes dashboard components running the following command: